
Piqelo Monitors.
Piqelo Monitor Compare · US market

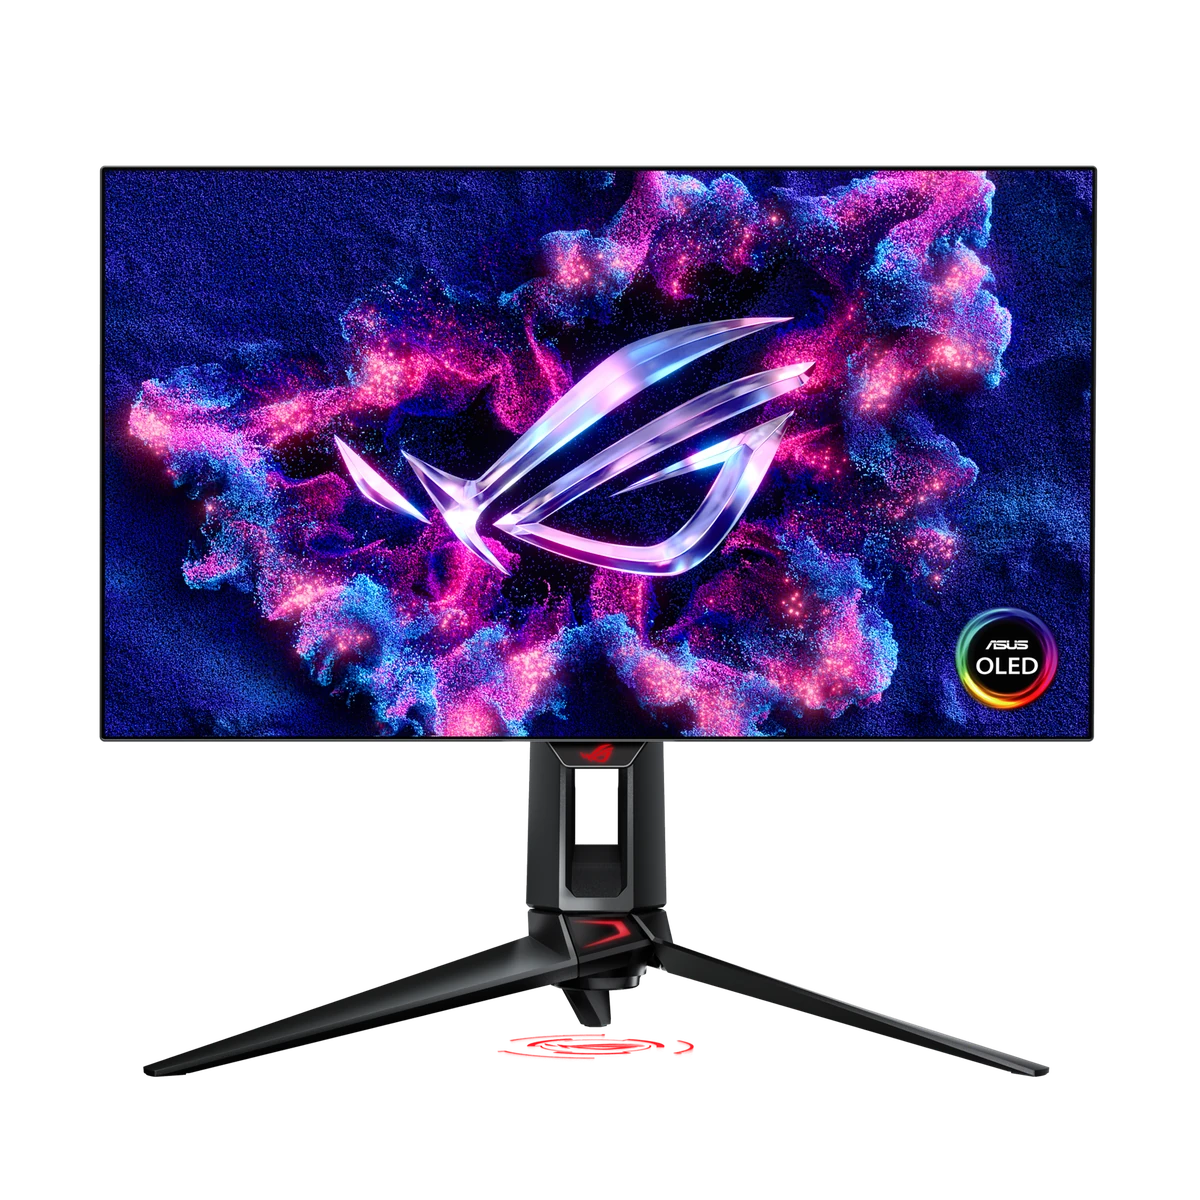
ASUS ROG Swift OLED PG27AQDP vs Dell Alienware AW2726DM

See the real strengths, the compromises and the evidence behind two monitors. Full review insights, clear differences and places to buy — together.

Need help narrowing it down? Open the Monitor Finder →

ASUS ROG Swift OLED PG27AQDPEsports specialist
Size
27"
Resolution
2560x1440
Panel
WOLED
Refresh
480Hz
HDMI 2.1
Piqelo Score82/100Current published score · 90% confidence
Piqelo Score82/100Our overall product assessment
Search Score82/100Match to your preferences

Match estimate · research ongoing

How these scores work

The Piqelo Score is our published assessment of this exact product, including value. Your search does not change it. The Search Score uses the underlying research, your preferences and comparison with similarly priced products. Value is counted once; budget and required features are hard limits.

Product score published: 2026-10-10.

The match remains an estimate while supporting research is checked. It is not a new final product score.

Price comparison: $573.75 to $956.25 (±25% of this product’s price).

Compare similar products
  • ASUS ROG Swift OLED PG27UCDM 27" · $949.00 · Piqelo Score 86/100
  • Dell Alienware AW2725Q 27" · $699.99 · Piqelo Score 86/100
  • Dell Alienware AW2725DF 27" · $602.25 · Piqelo Score 85/100
Choose this for

Esports and very high-FPS PC gaming

Think twice if

You prioritize 4K desktop detail or mostly static office work
Full Piqelo Review →
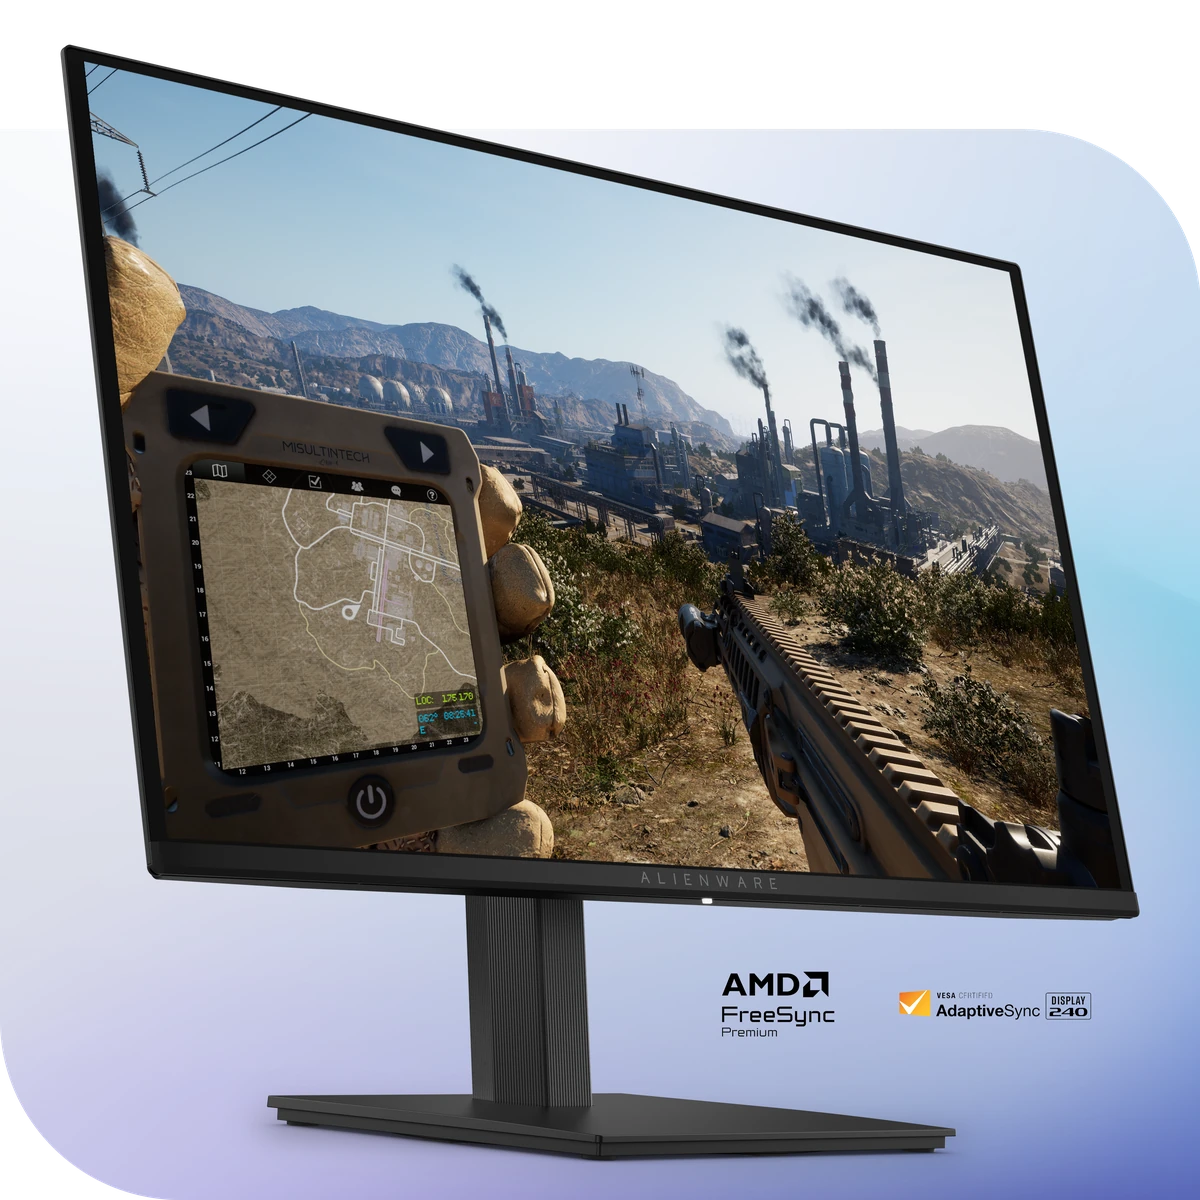
Dell Alienware AW2726DMOLED value gaming
Size
27"
Resolution
2560x1440
Panel
QD-OLED
Refresh
240Hz
Piqelo Score84/100Current published score · 90% confidence
Piqelo Score84/100Our overall product assessment
Search Score84/100Match to your preferences

Match estimate · research ongoing

How these scores work

The Piqelo Score is our published assessment of this exact product, including value. Your search does not change it. The Search Score uses the underlying research, your preferences and comparison with similarly priced products. Value is counted once; budget and required features are hard limits.

Product score published: 2026-10-08.

The match remains an estimate while supporting research is checked. It is not a new final product score.

Price comparison: $262.50 to $437.48 (±25% of this product’s price). Comparable evidence is limited.

Choose this for

Lower-cost entry into 240Hz QD-OLED PC gaming

Think twice if

You need HDMI 2.1 4K120 console support, USB-C or KVM

Full Piqelo Review →
Ready to buy?

Where to buy each monitor

Exact-model US offers in dollars, before sales tax. Amazon has a separate price check.

Piqelo may earn a commission through affiliate links at no extra cost to you. Commission never changes a product Rating, recommendation or retailer order.

Side by side

The differences that matter

Monitor specifications side by side
What mattersROG Swift OLED PG27AQDPAlienware AW2726DM
Screen size27"27"
Resolution2560x14402560x1440
PanelWOLEDQD-OLED
Native refresh480Hz240Hz
Dual modeNot listedNot listed
Response specification0.03 ms GTG0.03 ms GTG
HDMI 2.1YesNo
USB-C powerNot listedNot listed
KVM switchingNoNo
UltrawideNoNo

These are product specifications. Source-reported response and delay measurements appear in the test results below.

From the full reviews

What you gain. What you give up.

ASUS ROG Swift OLED PG27AQDP

A 27-inch 1440p WOLED built around extremely high-refresh PC gaming, with HDMI 2.1 for modern consoles and strong HDR contrast.

Plus points
  • 480Hz native refresh for very high-frame-rate play
  • Near-instant OLED pixel response and deep blacks
  • HDMI 2.1 and broad VRR support
Keep in mind
  • 1440p is less detailed than 4K for desktop work
  • OLED burn-in remains a consideration for static-heavy use
  • Text clarity is not its strongest office trait
PC gamingConsoleMixed use

Dell Alienware AW2726DM

A 27-inch 1440p QD-OLED positioned as a lower-cost entry into OLED gaming, with 240Hz refresh and excellent motion response.

Plus points
  • 240Hz QD-OLED motion clarity
  • Deep blacks and wide color
  • Strong gaming value positioning
Keep in mind
  • No HDMI 2.1 4K120 console path
  • No USB hub or KVM
  • Limited brightness versus stronger OLED implementations
PC gamingMixed use
Independent testing

Picture quality and motion, explained

Keep the source, picture mode and test method in view. Results from different methods are not directly comparable.

ASUS ROG Swift OLED PG27AQDP

Test results

Image quality, explained

Selected independent measurements, with what they mean in everyday use. Picture mode and test method matter; these results are not additional Piqelo scores.

Everyday brightness

Higher = brighter
SDR peak brightness
400 nits

SDR is everyday desktop content. More brightness can help in a lit room; reflections and the size of the bright area still matter.

HDR highlights

Higher = brighter highlights
HDR peak
709 nits25% window

HDR measures bright highlights in games and video. A small-window peak is different from full-screen brightness, so check the window and mode.

Color accuracy

Lower ΔE = less error
Grayscale error · ΔE
4.35 DeltaEDefault
Grayscale error · ΔE
0.53 DeltaECalibrated
Grayscale error · ΔE
2.87 DeltaEsRGB Cal

Delta E measures the difference from the target color or gray. A calibrated result describes that setup; it does not establish factory accuracy.

One independently tested sample; lab settings and methods affect results.

Color range

Coverage and volume differ
DCI-P3 coverage
>97%

Coverage is how much of a named color space is reproduced. Gamut volume describes its overall extent and can exceed 100%; it is not coverage or accuracy.

Motion & delay

Lower time = faster
Screen draw time
2 ms480Hz
Total input lag
15 ms480Hz

Pixel response affects moving edges. Input lag is delay before the image starts changing; screen draw and signal processing are separate tests. Compare like-for-like methods.

Total control lag includes more than signal processing. Compare it with the same timing method.

Screen consistency

Lower variation = more even
Brightness variation
2.4%

Variation shows how much brightness or dark-screen appearance differs across the panel. Check the test pattern and any uniformity setting before comparing results.

Single review sample.

No independent measured result in this profile yet for black depth & contrast.

Explore all findings, test settings and sources

Dell Alienware AW2726DM

Test results

Image quality, explained

Selected independent measurements, with what they mean in everyday use. Picture mode and test method matter; these results are not additional Piqelo scores.

Everyday brightness

Higher = brighter
SDR brightness
189 nitscalibrated maximum
SDR brightness
30 nitsminimum

SDR is everyday desktop content. More brightness can help in a lit room; reflections and the size of the bright area still matter.

HDR highlights

Higher = brighter highlights
HDR brightness
380 nits2% window
HDR brightness
380 nits10% window
HDR brightness
186 nits100% window

HDR measures bright highlights in games and video. A small-window peak is different from full-screen brightness, so check the window and mode.

Color accuracy

Lower ΔE = less error
Grayscale error · ΔE
4.15 DeltaEOut of box
Grayscale error · ΔE
0.56 DeltaECalibrated

Delta E measures the difference from the target color or gray. A calibrated result describes that setup; it does not establish factory accuracy.

One independently tested sample; lab settings and methods affect results.

Motion & delay

Lower time = faster
Black-to-white response
0.24 msOne-inch square

Pixel response affects moving edges. Input lag is delay before the image starts changing; screen draw and signal processing are separate tests. Compare like-for-like methods.

Response, signal processing and total lag are different metrics; do not compare across lab methods.

No independent measured result in this profile yet for black depth & contrast, color range, screen consistency.

Explore all findings, test settings and sources
Living with it

Owner experience and recurring cautions

ASUS ROG Swift OLED PG27AQDP

Dell Alienware AW2726DM

Research & details

Explore the evidence behind both reviews

Every attached finding, measurement, source and limitation stays available.

ASUS ROG Swift OLED PG27AQDP

Sources, findings & specifications
Recommendation stabilityHighMultiple independent sources support a high-confidence exact-model profile.
Owner evidence4.0/5Exact-model owner signal is kept separate from expert testing.
Current buying routes5Commerce never changes the recommendation order.

Official product views

ASUS ROG Swift OLED PG27AQDP

All exact-model findings

Context finding · excluded from rating · owner experience

One incentivized Best Buy review is separate from fourteen manufacturer-syndicated ASUS reviews; those fourteen are excluded from the independent pool.

Best Buy Open exact source →
Supported finding · vrr behavior

Anti-flicker modes reduce flicker under changing frame rates but have operating trade-offs; this is not a long-term failure-rate test.

TFTCentral Open exact source →
Supported finding · hdr image

Tom’s Hardware measured 709 nits using a 25% HDR window; SDR peak was 400 nits. Different window sizes must not be treated as directly equivalent.

HDR peak
709 nits25% window
SDR peak brightness
400 nits
Tom's Hardware Open exact source →
Supported finding · color accuracy

The exact PG27AQDP test reports DCI-P3 gamut coverage above 97%. Coverage does not by itself establish calibrated color error.

DCI-P3 coverage
>97%
Tom's Hardware Open exact source →
Supported finding · input latency

Tom’s Hardware measured a 2ms full-white screen draw and 15ms total control lag at QHD 480Hz. These are distinct screen-draw and complete-lag metrics, not the manufacturer’s grey-to-grey response specification.

Screen draw time
2 ms480Hz
Total input lag
15 ms480Hz

Tom’s Hardware test method; total control lag must not be compared directly with processing-delay-only results.

Tom's Hardware Open exact source →
Supported finding · sdr image

The PG27AQDP review unit had a 2.4% screen-uniformity deviation. This is one tested panel and does not guarantee identical uniformity across retail units.

Brightness variation
2.4%

Single review sample.

Tom's Hardware Open exact source →
Supported finding · color

Grayscale error measured 4.35 dE before calibration, 0.53 after calibration, and 2.87 in sRGB Cal. Calibrated gamma averaged 2.30.

Grayscale error · ΔE
4.35 DeltaEDefault
Grayscale error · ΔE
0.53 DeltaECalibrated
Grayscale error · ΔE
2.87 DeltaEsRGB Cal
Gamma
2.3 gammaCalibrated

One independently tested sample; lab settings and methods affect results.

Tom's Hardware Open exact source →
Supported finding · sdr image

TFTCentral measured SDR 425 nits (Uniform Brightness off); SDR 255 nits (Uniform Brightness off; full field); SDR 259 nits (Uniform Brightness on); SDR 29 nits (Minimum; Uniform Brightness on).

SDR brightness
425 nitsUniform Brightness off
SDR brightness
255 nitsUniform Brightness off; full field · 100% window
SDR brightness
259 nitsUniform Brightness on
SDR brightness
29 nitsMinimum; Uniform Brightness on

APL/window size was not specified for peak values unless attached; Uniform Brightness settings differ.

TFTCentral Open exact source →
Supported finding · motion

TFTCentral reported 0.44 ms average G2G response (Tested gaming mode); 19.1 ms total display lag (60Hz).

average gtg response
0.44 msTested gaming mode · mean
total display lag
19.1 ms60Hz · 60Hz

Response, signal processing and total lag are different metrics; do not compare across lab methods.

TFTCentral Open exact source →
Supported finding · color

TFTCentral measured 97.2% DCI-P3, 95.7% Adobe RGB gamut coverage.

color gamut coverage
97.2%Native gamut; absolute coverage · DCI-P3
color gamut coverage
95.7%Native gamut; absolute coverage · Adobe RGB

Coverage is distinct from gamut volume and does not establish color accuracy.

TFTCentral Open exact source →
Supported finding · color

TFTCentral measured 95.1% sRGB gamut coverage.

color gamut coverage
95.1%sRGB emulation; absolute coverage · sRGB

Coverage is distinct from gamut volume and does not establish color accuracy.

TFTCentral Open exact source →

Original sources

Manufacturer specification sourceASUS is attached as manufacturer specification evidence for ASUS ROG Swift OLED PG27AQDP.Checked 2026-09-28Open exact source →
Owner context · excluded from rating · 5.0/5 · 1 reviewsBest Buy's own pool contains one 5/5 incentivized review. The separate 14-review ASUS-syndicated pool is excluded from this count. One short ownership report cannot support a definitive owner or reliability score.Checked 2026-09-30Open exact source →
Exact-model owner reviewsExact PG27AQDP product pool: 51 ratings, including 32 written reviews and 19 rating-only submissions. This is a product aggregate, distinct from the seller rating. Eight native reviews were inspected; a mature unincentivized subpool could not be fully verified.Uses only 32 written exact-model reviews retained by Newegg non-incentivized filter; seller rating and 19 rating-only submissions excluded.Checked 2026-10-10Open exact source →
Independent expert sourceRTINGS is attached as independent expert evidence for ASUS ROG Swift OLED PG27AQDP.Checked 2026-09-28Open exact source →
Independent expert sourceLab review finds strong 480Hz motion clarity and low lag. Anti-flicker modes reduce VRR flicker with operating trade-offs; these tests do not establish long-term reliability.Checked 2026-10-07Open exact source →
Independent expert sourceExact-model testing reports over 97% DCI-P3 coverage, 400-nit SDR peak and 709-nit HDR on a 25% window. Strong 480Hz gaming capability; no speakers. Measured brightness is kept separate from smaller-window peak claims.Checked 2026-10-07Open exact source →
Context source · excluded from ratingGeneral category or buying-guide context. Does not establish an independent exact-model test or supply a numeric Piqelo Rating component.Checked 2026-09-28Open exact source →
Full Piqelo Review →

Dell Alienware AW2726DM

Sources, findings & specifications
Recommendation stabilityHighMultiple independent sources support a high-confidence exact-model profile.
Owner evidence4.8/5Exact-model owner signal is kept separate from expert testing.
Current buying routes4Commerce never changes the recommendation order.

Official product views

Dell Alienware AW2726DM

All exact-model findings

Supported finding · hdr image

TechSpot measured 380 nits at both 2% and 10% HDR windows, 186 nits full-screen and 260 nits averaged across eight real scenes. The low-cost panel omits a Peak 1000 mode.

HDR brightness
380 nits2% window
HDR brightness
380 nits10% window
HDR brightness
186 nits100% window
HDR real-scene average
260 nits8 scenes
TechSpot Open exact source →
Supported finding · sdr image

After calibration TechSpot measured 189 nits maximum and 30 nits minimum SDR output. Uniform brightness is enabled by default and cannot be disabled.

SDR brightness
189 nitscalibrated maximum
SDR brightness
30 nitsminimum
TechSpot Open exact source →
Supported finding · hdr image

WIRED measured sustained SDR at 202 nits and HDR at 398 nits with a 10% window. Full-screen HDR was no brighter than SDR. These are separate measurements from TechSpot’s calibrated test.

SDR brightness
202 nitssustained
HDR brightness
398 nits10% window
WIRED Open exact source →
Supported finding · motion

Tom's Hardware reported 0.24 ms black-to-white transition (One-inch square); 13.6 ms total control lag (Tested gaming mode).

Black-to-white response
0.24 msOne-inch square
total control lag
13.6 msTested gaming mode

Response, signal processing and total lag are different metrics; do not compare across lab methods.

Tom's Hardware Open exact source →
Supported finding · color

Grayscale error improved from 4.15 to 0.56 dE with calibration. Gamut error improved from 2.50 to 1.74 dE.

Grayscale error · ΔE
4.15 DeltaEOut of box
Grayscale error · ΔE
0.56 DeltaECalibrated
gamut delta e
2.5 DeltaEOut of box
gamut delta e
1.74 DeltaECalibrated

One independently tested sample; lab settings and methods affect results.

Tom's Hardware Open exact source →

Original sources

Exact-model owner reviews · 4.8/5 · 307 reviewsA large exact-model owner sample rates the AW2726DM very highly, reinforcing its gaming-first fit.Checked 2026-09-28Open exact source →
Manufacturer specification sourceDell is attached as manufacturer specification evidence for Dell Alienware AW2726DM.Checked 2026-09-28Open exact source →
Independent expert sourceRTINGS is attached as independent expert evidence for Dell Alienware AW2726DM.Checked 2026-09-28Open exact source →
Independent expert sourceOriginal budget 27-inch 1440p 240Hz QD-OLED review evaluates AW2726DM's feature choices. AW2725DM and AW2728DM results are excluded.Checked 2026-09-30Open exact source →
Independent expert sourceDedicated AW2726DM QHD 240Hz QD-OLED test adds exact-model evidence beyond a general OLED buying guide. Review-time pricing is not a current quote.Checked 2026-10-07Open exact source →
Context source · excluded from ratingGeneral category or buying-guide context. Does not establish an independent exact-model test or supply a numeric Piqelo Rating component.Checked 2026-09-28Open exact source →
Independent expert sourceDedicated AW2726DM hands-on review assesses the 27-inch 240Hz QD-OLED as an affordable gaming screen. Distinct from manufacturer warranty claims and AW2728DM.Checked 2026-09-30Open exact source →
Independent expert sourceThe review measured 202-nit sustained SDR and 398-nit HDR at a 10% window. Low brightness is the main compromise; the display works best with controlled room lighting.Checked 2026-09-30Open exact source →
Full Piqelo Review →

No generic winner. Choose the strengths that suit your desk, games and daily use. For a recommendation tailored to your budget, use the Monitor Finder →

Keep exploring

Monitor head-to-head comparisons

Trust & transparencyIndependent by design.

Some retailer links may be affiliate links. Commercial relationships never buy a score, recommendation, award or retailer order. As an Amazon Associate I earn from qualifying purchases.